
2.2.2What do limits have to do with continuity?
Intuitive Ideas of Continuity
Examine the graph of
One of the limit statements above determines the horizontal asymptote of
. Which one? Explain. Sketch a graph of
. Describe the end behavior of the graph by writing two limit statements, one for each of its horizontal asymptotes.
On your graphing calculator, graph
Describe what happens to
as approaches on each side? (i.e. Evaluate and .) Do both sides (the left-hand and right-hand limits) agree?
What is
?
For each function below, explain why the limit does not exist at
.png)
.png)
Sketch
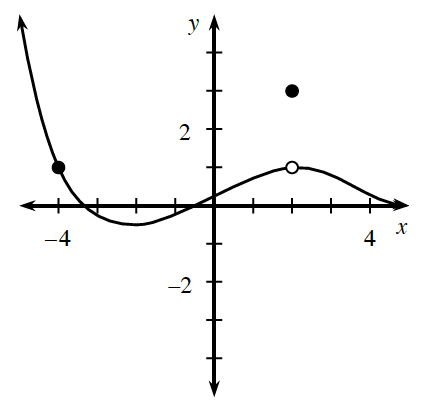
Now let’s look at the relationship between limits and continuity. Examine the graph at right and use it to complete the table below.
If a limit does not exist, enter “DNE” into your table.

Look at your results from problem 2-61 and consider the relationship between limits and continuity by analyzing the following conditions. Justify each response with sketches that show examples and/or counterexamples.
Is a function continuous at
if does not exist? Is a function continuous at
if does not exist? Is a function continuous if both
and exist? Use your answers from parts (a) through (c) to explain when a function is continuous at a point.
Given the graph at right, determine the following values.
Is the function continuous at
? Explain.
.png)

Kimberly is always complaining that it is either too hot or too cold. As a matter of fact, she is so picky that she is only happy when it is exactly
Is there a time when Kimberly is happy?
If at 6:00 p.m. the temp is
, what is the minimum number of times Kimberly was happy today?
A mug of hot coffee is poured and then set on the counter. Homework Help ✎
Sketch a feasible graph showing the temperature of the coffee as a function of time. Do not worry about units, just show the general behavior of the graph.
Evaluate the following limit and translate the entire limit statement into a complete sentence.
.png)
Using set notation, state the domain and range for each of the functions below. Homework Help ✎
.png)
.png)
Sketch one function that satisfies all of the following conditions. Does your graph have any asymptotes? Homework Help ✎
If you plot the finite differences of a parabola, the result will be what type of function? Homework Help ✎
Using sigma notation, write a Riemann sum to estimate the area under the function
.png)
Alter your sigma notation from problem 2-69 to estimate the area with
THE CLUNKER
Tiffani has an old car that she is constantly repairing. One day, she is driving to school when she starts having problems with the car’s fuel injection system. Her velocity (in feet per second) is shown at right. Homework Help ✎
Recall that acceleration is the rate of change of velocity. How is acceleration represented on a velocity graph?
When is her acceleration negative?
What is her maximum acceleration?
Describe the motion of the vehicle when the acceleration is zero.
How far does Tiffani travel during the
seconds shown in the graph?
.png)


